Explore Ocean Data
Through Time
Navigate through years of ARGO float data, discover insights, and understand how our oceans are changing over time.
Interactive Timeline
Explore ARGO data across different time periods and observe ocean changes
January 2024
Selected time period
4,247
Active Floats
892,456
Measurements
18.2°C
Avg Temperature
35.1
Avg Salinity (PSU)
Temperature anomaly detected in North Atlantic
New float deployment in Pacific
Featured Insights
Discover the latest findings and research from ARGO data analysis
Global Ocean Warming Accelerates
ARGO data reveals unprecedented warming rates in the upper 2000m of the ocean, with implications for sea level rise and marine ecosystems.

Deep Water Formation Patterns Shift
New analysis of ARGO float data shows changing patterns in deep water formation, particularly in the North Atlantic and Southern Ocean.
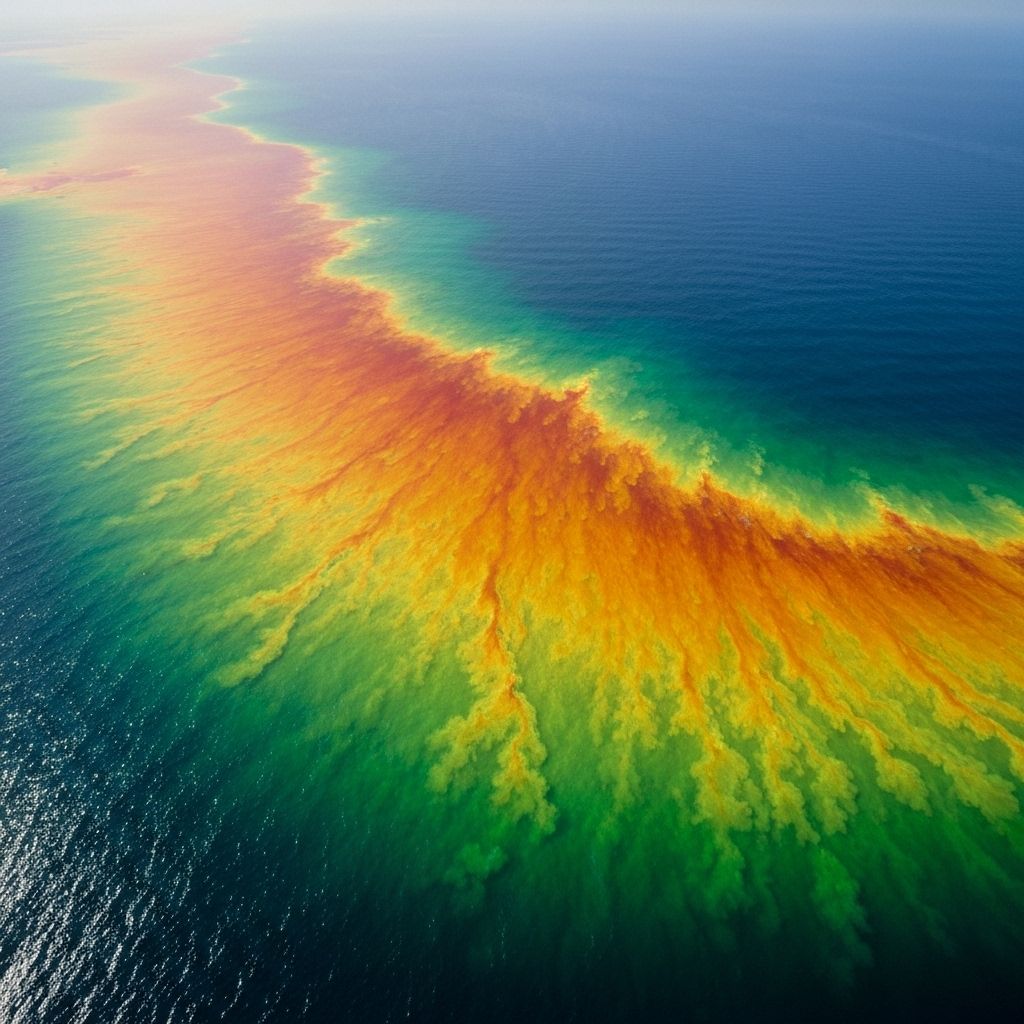
Marine Heatwaves Increase in Frequency
ARGO temperature records document a 50% increase in marine heatwave events over the past decade, affecting global fisheries.
ARGO by the Numbers
Understanding the scale and impact of the global ARGO network
Global ARGO Network
4,000+
Active Floats Worldwide
Autonomous floats collecting data across all ocean basins
Temperature Monitoring
0-2000m
Depth Range Coverage
Continuous temperature profiling from surface to deep ocean
Salinity Precision
±0.003
PSU Accuracy
High-precision conductivity sensors for salinity measurement
Data Collection
2M+
Profiles Per Year
Massive dataset enabling climate research and forecasting
Ready to Dive Deeper?
Access the full dashboard for detailed analysis and real-time monitoring